Linux
Linux software install
Google repo的使用
Vector AP StartApplication编译脚本解析
Yocto的cmake版本升级
不能自动安装的解决方式
S32G-BSP35.0-SDK使用方法
S32G从SDK生成文件系统的制作过程
Linux Samba设置
Linux添加双网卡
S32G USB-Redirector安装指南
VS code自动生成Doxygen格式注释
Linux下使用多线程下载
使用pandoc 生成带中文的pdf
minicom无法输入的问题解决办法
使用 systemd unit 添加一条路由规则
CMake 教程
步骤 1:基本起点
步骤 2:添加lib库
步骤 3:为库添加使用要求
步骤 4:添加生成器表达式
步骤 5:安装和测试
步骤 6:添加支持测试仪表板
步骤 7: 添加系统内省
步骤 8:自定义命令和生成的文
步骤 9:打包安装程序
步骤 10:选择静态库或共享库
步骤 11:添加导出配置
步骤 12:打包 Debug 和 Release
添加虚拟网卡
Vector AP 去掉防篡改校验
Vector AP startapplication编译与使用
Vector AP问题汇总
Vector AP大型项目开发流程
Vector AP EM
Vector AP 最简单的开发示例
Linux kernel 版本降级
Vector AP StartApplicaiton
startappplication-machine-design
startapplicaiton-machine-integration
amsr-vector-fs-em-executionmanager-design
amsr-vector-fs-em-executionmanager
Vector AP 复杂模型的开发
第一章 Machine和MachineDesign
第二章 Execute Manager
第三章 Log
第四章 State Manager
第五章 State Manager 源码的理解
第六章 Someip daemon
第七章 IPC Service Discovery Daemon
crond的使用方法
解决蓝牙鼠标在 Ubuntu 中单位时间内断开的问题
VPS服务器自建教程
v2rayA的客户端使用配置
GDB调试指南入门篇:揭开程序运行世界的神秘面纱
GDB调试指南高级篇:成为调试专家,掌控程序的命运
Linux安装PyQt5并配置Qt Designer
ADB 命令大全
GoogleTest(一)
GoogleTest(二)简单的TEST宏
GoogleTest(三)简单类函数测试
C++ Template
1. 函数模板
2. 类模板
3. 非类型模板参数
软件版本号规范
EPOLL
C++手札
C++ 使用{}初始化有哪些好处?
现代 C++ decltype 深入解析
函数对象(functor)
Linux性能剖析:CPU、内存、网络与I/O压力测试
AP StateManager
C++ Lambda表达式
C++ 中的Lambda表达式
Lambda 表达式语法
Lambda 表达式的示例
手动发送UDP数据包
pyqt5生成的UI界面不能输入中文
自己搭建repo镜像
摄影
Sony仿富士PP值设置
诗词歌赋
本文档使用 MrDoc 发布
-
+
首页
GDB调试指南高级篇:成为调试专家,掌控程序的命运
在这篇文章中,你可以学习到以下内容: - 多线程和多进程程序的调试。 - 核心转储(core dumps)的分析。 - GDB 的高级断点技术,如条件断点和监视点。 - 使用 GDB 自定义命令和扩展。 ## **前言** 在我们的[《GDB调试指南入门篇:揭开程序运行世界的神秘面纱》](http://samlee820820.synology.me:10086/doc/106/)你已经学会了如何使用GDB这把锋利的“调试匕首”,去割除程序中显而易见的bug。随着你进一步踏入程序世界的深渊,你会发现一些更为狡猾的故障,它们隐藏在程序的阴影中,等待你用更高阶的技巧去捕捉它们。在这篇高级篇中,让我们装备上更先进的“探险工具”,深入程序的核心,掌控其运行的命运。 ## **gdb命令** GDB 的 info命令是一个功能丰富的命令集,用于获取各种运行时调试信息。 info 命令后必须跟上一个子命令来指定要检索的信息类型。使用 info 命令,调试者可以查询程序及其执行环境的详细信息,例如当前的栈帧、变量、寄存器值、内存布局、线程状态等等。 以下是一些常用的 info 子命令和它们的用途的总结: \- info address : 显示特定符号的存储位置。 \- info all-registers : 列出当前栈帧中所有寄存器的内容。 \- info args : 显示当前栈帧的函数参数。 \- info breakpoints : 列出所有断点的状态信息。 \- info functions : 显示程序中所有匹配特定模式的函数。 \- info locals : 列出当前栈帧的所有局部变量。 \- info registers : 列出当前栈帧中的特定类型寄存器内容。 \- info threads : 显示当前已知的所有线程。 \- info variables : 列出所有全局和静态变量。 \- info sharedlibrary : 显示已加载的共享库的信息。 ## **info详细命令** info 命令还包括许多其他子命令,使调试者能够访问与程序的运行和调试设置有关的各种信息。 info 子命令非常适合用于对程序的内部状态进行深入探查,了解程序运行时的具体情况,以及在调试和优化程序过程中进行具体问题分析的需要。总而言之, info 命令集是 GDB 中用于获取关于正在调试程序各个方面详尽信息的重要工具。 ```shell (gdb) info 'info' must be followed by the name of an info command. List of info subcommands: info address -- Describe where symbol SYM is stored. info all-registers -- List of all registers and their contents, for selected stack frame. info args -- All argument variables of current stack frame or those matching REGEXPs. info auto-load -- Print current status of auto-loaded files. info auxv -- Display the inferior\'s auxiliary vector. info bookmarks -- Status of user-settable bookmarks. info breakpoints -- Status of specified breakpoints (all user-settable breakpoints if no argument). info checkpoints -- IDs of currently known checkpoints. info classes -- All Objective-C classes, or those matching REGEXP. info common -- Print out the values contained in a Fortran COMMON block. info copying -- Conditions for redistributing copies of GDB. info dcache -- Print information on the dcache performance. info display -- Expressions to display when program stops, with code numbers. info exceptions -- List all Ada exception names. info extensions -- All filename extensions associated with a source language. info files -- Names of targets and files being debugged. info float -- Print the status of the floating point unit. info frame -- All about the selected stack frame. info frame-filter -- List all registered Python frame-filters. info functions -- All function names or those matching REGEXPs. info guile -- Prefix command for Guile info displays. info handle -- What debugger does when program gets various signals. info inferiors -- Print a list of inferiors being managed. info line -- Core addresses of the code for a source line. info locals -- All local variables of current stack frame or those matching REGEXPs. info macro -- Show the definition of MACRO, and it\'s source location. info macros -- Show the definitions of all macros at LINESPEC, or the current source location. info mem -- Memory region attributes. info module -- Print information about modules. info modules -- All module names, or those matching REGEXP. info os -- Show OS data ARG. info pretty-printer -- GDB command to list all registered pretty-printers. info probes -- Show available static probes. info proc -- Show additional information about a process. info program -- Execution status of the program. info record -- Info record options. info registers -- List of integer registers and their contents, for selected stack frame. info scope -- List the variables local to a scope. info selectors -- All Objective-C selectors, or those matching REGEXP. info set -- Show all GDB settings. info sharedlibrary -- Status of loaded shared object libraries. info signals -- What debugger does when program gets various signals. info skip -- Display the status of skips. info source -- Information about the current source file. info sources -- All source files in the program or those matching REGEXP. info stack -- Backtrace of the stack, or innermost COUNT frames. --Type <RET> for more, q to quit, c to continue without paging-- info static-tracepoint-markers -- List target static tracepoints markers. info symbol -- Describe what symbol is at location ADDR. info target -- Names of targets and files being debugged. info tasks -- Provide information about all known Ada tasks. info terminal -- Print inferior\'s saved terminal status. info threads -- Display currently known threads. info tracepoints -- Status of specified tracepoints (all tracepoints if no argument). info tvariables -- Status of trace state variables and their values. info type-printers -- GDB command to list all registered type-printers. info types -- All type names, or those matching REGEXP. info unwinder -- GDB command to list unwinders. info variables -- All global and static variable names or those matching REGEXPs. info vector -- Print the status of the vector unit. info vtbl -- Show the virtual function table for a C++ object. info warranty -- Various kinds of warranty you do not have. info watchpoints -- Status of specified watchpoints (all watchpoints if no argument). info win -- List of all displayed windows. info xmethod -- GDB command to list registered xmethod matchers. Type 'help info' followed by info subcommand name for full documentation. Type 'apropos word' to search for commands related to 'word'. Type 'apropos -v word' for full documentation of commands related to 'word'. Command name abbreviations are allowed if unambiguous. ``` ``` 命令 'info' 必须跟随一个具体的 info 子命令。 info 子命令列表: info address -- 描述符号 SYM 存储的位置。 info all-registers -- 列出选定栈帧的所有寄存器及其内容。 info args -- 当前栈帧的所有参数变量或匹配 REGEXPs 的参数变量。 info auto-load -- 打印自动加载文件的当前状态。 info auxv -- 显示下层系统的辅助向量。 info bookmarks -- 用户设置的书签状态。 info breakpoints -- 指定断点的状态(如果没有参数,则为所有用户设置的断点)。 info checkpoints -- 当前已知检查点的 ID。 info classes -- 所有 Objective-C 类,或匹配 REGEXP 的类。 info common -- 打印 Fortran COMMON 块中的值。 info copying -- 关于分发 GDB 副本的条件。 info dcache -- 打印 dcache(数据缓存)性能信息。 info display -- 程序停止时要展示的表达式,包括代码编号。 info exceptions -- 列出所有 Ada 异常名。 info extensions -- 与源代码语言关联的所有文件扩展名。 info files -- 正在调试的目标和文件的名称。 info float -- 打印浮点单元的状态。 info frame -- 有关选定栈帧的所有信息。 info frame-filter -- 列出所有注册的 Python 栈帧过滤器。 info functions -- 所有函数名或匹配 REGEXPs 的函数名。 info guile -- Guile 信息显示的前缀命令。 info handle -- 调试器在程序接收到各种信号时的操作。 info inferiors -- 打印正被管理的下层系统列表。 info line -- 源代码行对应的核心地址。 info locals -- 当前栈帧的所有局部变量或匹配 REGEXPs 的局部变量。 info macro -- 显示宏 MACRO 的定义及其来源位置。 info macros -- 在 LINESPEC 显示所有宏的定义,或者当前源代码位置。 info mem -- 内存区域属性。 info module -- 打印有关模块的信息。 info modules -- 所有模块名,或匹配 REGEXP 的模块。 info os -- 显示操作系统数据 ARG。 info pretty-printer -- GDB 命令,列出所有注册的美化输出器。 info probes -- 显示可用的静态探测点。 info proc -- 显示有关进程的附加信息。 info program -- 程序的执行状态。 info record -- 信息记录选项。 info registers -- 列出选定栈帧的整数寄存器及其内容。 info scope -- 列出与作用域局部相关的变量。 info selectors -- 所有 Objective-C 选择器,或匹配 REGEXP 的选择器。 info set -- 显示所有 GDB 设置。 info sharedlibrary -- 已加载的共享对象库的状态。 info signals -- 调试器在程序接收到各种信号时的操作。 info skip -- 显示跳过的状态。 info source -- 有关当前源文件的信息。 info sources -- 程序中的所有源文件或匹配 REGEXP 的源文件。 info stack -- 栈的回溯,或最内层 COUNT 帧。 -- 输入 <RET> 查看更多,输入 q 退出,输入 c 继续查看不分页 -- info static-tracepoint-markers -- 列出目标静态跟踪点标记。 info symbol -- 描述地址 ADDR 处的符号。 info target -- 正在调试的目标和文件的名称。 info tasks -- 提供有关所有已知 Ada 任务的信息。 info terminal -- 打印下层系统保存的终端状态。 info threads -- 显示当前已知线程。 info tracepoints -- 指定跟踪点的状态(如果没有参数,则为所有跟踪点)。 info tvariables -- 跟踪状态变量及其值的状态。 info type-printers -- GDB 命令,列出所有注册的类型输出器。 info types -- 所有类型名,或匹配 REGEXP 的类型名。 info unwinder -- GDB 命令,列出反卷积器。 info variables -- 所有全局和静态变量名或匹配 REGEXPs 的变量名。 info vector -- 打印向量单元的状态。 info vtbl -- 显示 C++ 对象的虚函数表。 info warranty -- 您没有的各种类型的保证。 info watchpoints -- 指定监视点的状态(如果没有参数,则为所有监视点)。 info win -- 所有显示窗口的列表。 info xmethod -- GDB 命令,列出注册的 xmethod 匹配器。 输入 'help info' 后跟 info 子命令名称以获取完整文档。 输入 'apropos word' 来搜索与 'word' 相关的命令。 输入 'apropos -v word' 获取与 'word' 相关命令的完整文档。如果不会引起混淆,允许使用命令名缩写。 ``` ### **多线程调试** 现代的应用程序常常使用到多线程技术来提升效率,但多线程调试也相应地带来了不少挑战。在GDB中,你可以用一些高级功能来探索多线程程序: - info threads:列出所有线程,查看程序的多线程结构。 - thread:切换到具体的线程,进行更细致的观察和调试。 - set follow-fork-mode:设置 GDB 如何跟踪 fork() 系统调用产生的进程。 ### **示例代码** 以下是一个多线程的C语言 demo 用例,该用例创建两个线程来更新相同的资源。这个示例利用 POSIX 线程库(pthread),在编译的时候需要链接-lpthread库。 该例子中包含一个简单的资源共享问题,因此可以用来练习 GDB 的多线程调试功能。 ```c++ #include <stdio.h> #include <stdlib.h> #include <pthread.h> #define NUM_THREADS 2 // 共享的数据 typedef struct SharedData { int count; pthread_mutex_t lock; } SharedData; SharedData shared = {0, PTHREAD_MUTEX_INITIALIZER}; // 线程的工作是增加共享计数器 void* increment_count(void* data) { SharedData *shared_data = (SharedData*)data; for (int i = 0; i < 100000; i++) { // 尝试获取互斥锁 pthread_mutex_lock(&shared_data->lock); shared_data->count += 1; pthread_mutex_unlock(&shared_data->lock); } pthread_exit(NULL); } int main() { pthread_t threads[NUM_THREADS]; // 创建两个线程 for (int i = 0; i < NUM_THREADS; i++) { int rc = pthread_create(&threads[i], NULL, increment_count, (void*)&shared); if (rc) { printf('ERROR; return code from pthread_create() is %d\n', rc); exit(-1); } } // 等待所有线程完成 for (int i = 0; i < NUM_THREADS; i++) { pthread_join(threads[i], NULL); } printf('最终计数器的值: %d\n', shared.count); // 销毁互斥锁 pthread_mutex_destroy(&shared.lock); pthread_exit(NULL); } ``` 保存上面的代码为mt\_demo.c。然后使用以下命令用 GCC 编译此代码,同时确保添加-g 以便生成调试信息和-l来链接 pthread 库: ```shell gcc -g -o mt_demo mt_demo.c -lpthread ``` 编译成功后可以使用 GDB 来调试这个程序 ```shell gdb ./mt_demo ``` 在 GDB 中,你可以尝试以下几个任务来练习多线程的调试: ### **列出存在的程序** 掌握info threads、thread命令,有效管理并调试多线程程序,理解并发环境下程序的行为。 使用 info threads 来查看所有的线程。 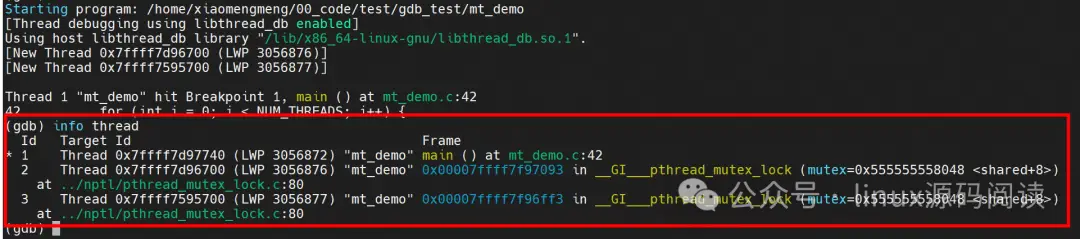 ### **切换线程** 使用 thread切换到一个指定的线程。  ### **核心转存分析** 当程序崩溃(例如,由于段错误)时,操作系统可以生成核心转储文件。这个文件包含了崩溃时刻程序的内存映像、寄存器状态、栈信息等。默认情况下,核心转储可能没有被启用或其大小限制可能设置得很低。我们可以通过命令在shell中启用它或增加核心转储文件大小的限制。 首先,确保允许生成核心转储文件,可以在终端中运行: ```shell ulimit -c unlimited ``` 这将会允许操作系统生成不受大小限制的核心转储文件。 现在,假设我们有一个C程序,它意外地试图解引用一个空指针,导致程序崩溃: ```c++ #include <stdio.h> int main() { int *ptr = NULL; printf('%d\n', *ptr); // 故意的空指针解引用产生段错误 return 0; } ``` 我们将这个代码保存到文件 crash.c 中,使用如下命令编译并启用调试信息: ```shell gcc -g -o crash crash.c ``` 在运行这个程序./crash之后,它会因为试图解引用NULL指针而崩溃,并且操作系统会在当前目录生成一个名为core或core.的核心转储文件(是进程ID)。 接下来,你可以使用GDB载入执行文件和核心转储文件进行调试: ```shell gdb ./crash core ``` 运行这个命令后,GDB会用核心转储文件初始化调试会话,这允许你检查程序崩溃时的状态。例如,你可以执行以下命令来查看程序崩溃时的栈跟踪: ```auto (gdb) bt ``` bt命令(backtrace的缩写)会显示导致程序崩溃的函数调用栈。你还可以使用各种GDB命令来查看程序崩溃时的变量值、寄存器状态以及其他各种有用的信息。这些信息对于理解崩溃的原因和确定出现错误的代码位置非常有帮助。 ## **采用条件断点和观测点** 在基础篇中,我们介绍了如何设置断点和观察点。在高级篇中,你将了解到如何更智能地使用它们: - 条件断点(conditional breakpoints):只有当满足特定条件时,程序才会在断点处暂停。 - 观察点(watchpoints):当某个变量的值发生变化时,程序会暂停。 下面将举例说明如何在 GDB 中使用条件断点和观察点。 ### **条件断点** 如下 C 代码,存储在名为 example.c 的文件中 ```c++ #include <stdio.h> int main() { for (int i = 0; i < 10; i++) { printf('i 的值是: %d\n', i); // 其他操作... } return 0; } ``` 在这个例子中,如果你只关心变量 i 的值为 5 时刻的情况,可以设置一个条件断点来只在这个条件满足时停止运行。首先,编译该程序并启用调试信息: ```shell gcc -g -o example example.c ``` 然后,在 GDB 中运行这个程序,并设置条件断点: ```shell gdb ./example ``` 在 GDB 中输入下列命令: ```auto (gdb) break example.c:6 if i == 5 (gdb) run ``` 上面的 break 命令在 example.c 文件的第 6 行设置了一个断点,并且指定了条件 i == 5。当循环迭代到 i 的值为 5 时,程序将会停止执行,允许你观察那时的程序状态。 ### **观察点 watchpoints** 现在假定我们想要监视一个变量何时被修改。以 example.c 的循环为例,如果你想要在变量 i 的值改变时暂停程序,你可以设置一个观察点: 在 GDB 中输入下列命令: ```shell (gdb) watch i (gdb) run ``` 此时,每当变量 i 的值改变时,GDB 会中断程序的执行。这允许你检查变量的当前值及其在内存中的状态,以及调用栈中的其他信息。 ### **性能分析和内存检查** GDB可以配合其他工具使用,如性能分析器和内存检查工具,来帮你诊断性能瓶颈和内存泄漏等问题。 ### **使用gprof进行性能分析** gprof 是一个性能分析工具,可以帮助你找到程序中的性能瓶颈。要使用它,需要在编译时加上 -pg 选项。这将会在程序运行后生成一个名为 gmon.out 的性能分析文件。 假设我们有一个简单的 C 程序 performance\_test.c,它包含了几个可以优化的函数: ```c++ #include <stdio.h> #include <unistd.h> void function1() { sleep(1); } void function2() { sleep(2); } int main() { function1(); function2(); return 0; } ``` 我们使用如下命令编译程序并启用 gprof: ```shell gcc -pg -o performance_test performance_test.c ``` 运行编译好的程序 : ```shell ./performance_test ``` 此时会生成 gmon.out 文件。我们使用 gprof 来分析这个文件: ```shell gprof ./performance_test gmon.out ``` gprof 将输出一个分析报告,其中包含时间消耗最多的函数和其他有用的性能信息。 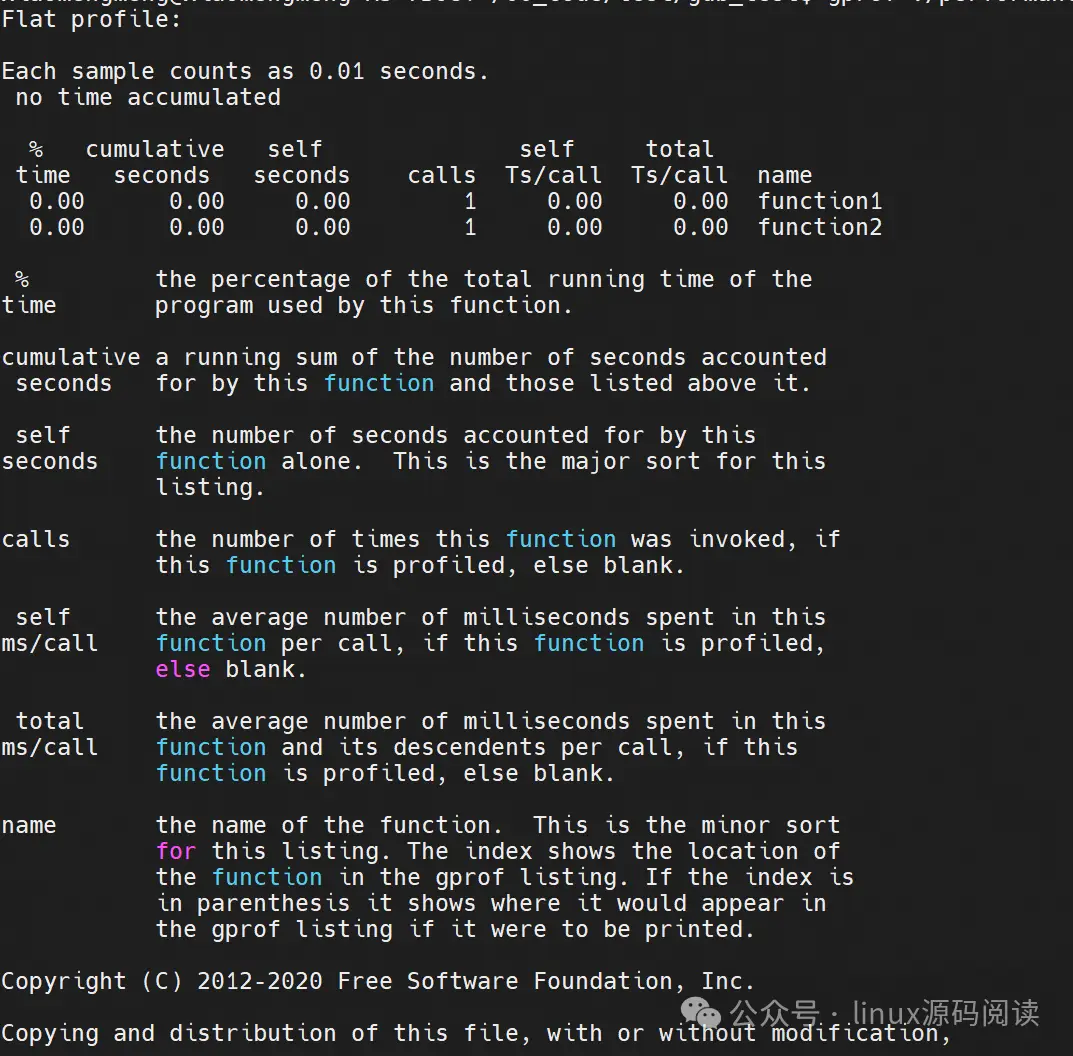 ## **使用Valgrind检查内存泄露** valgrind 是一个强大的内存检查工具,它可以帮助开发者检测运行时内存管理问题,例如内存泄漏、未初始化的内存访问和不正确的内存释放。 假设我们有以下 C 代码 memory\_test.c: ```c++ #include <stdlib.h> void alloc_memory() { char *ptr = malloc(10); // 分配内存而未释放 ptr[0] = 'a'; // 使用已分配的内存 } // 内存泄漏发生在这里,因为我们没有调用 free() int main() { alloc_memory(); return 0; } ``` 我们可以使用以下命令编译(不需要特殊的编译标志): ```shell gcc -o memory_test memory_test.c ``` 然后使用 运行这个程序帮助诊断内存问题: ```shell valgrind --leak-check=yes ./memory_test ``` \--leak-check=yes 选项告诉 valgrind 输出有关内存泄漏的信息。valgrind 将会执行程序并报告发现的任何内存问题,包括哪些内存未被释放和可能的泄漏源。 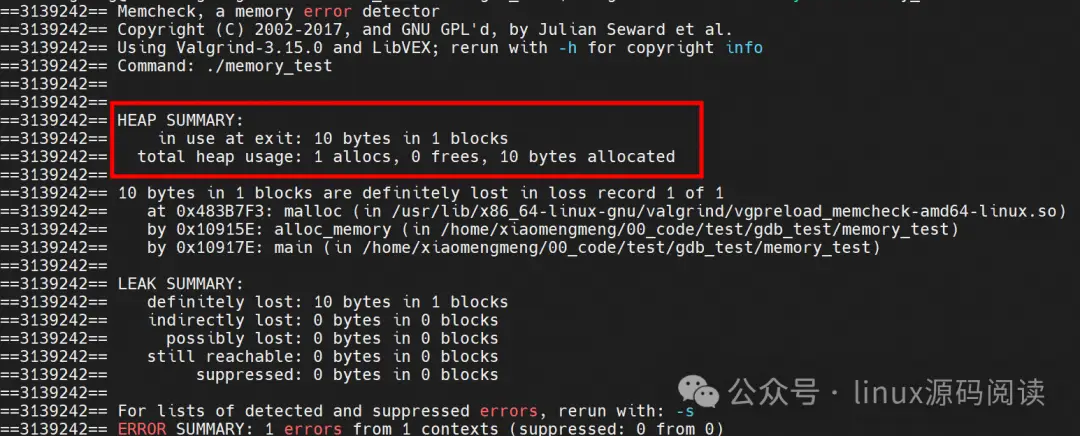 ## **小结** 作为一个志向成为调试专家的程序员,弄清楚一个错综复杂的bug所在,正是展现你技术深度和广度的时候。 了解并掌握GDB这位可靠的伙伴的深层技能,就如同让你拥有了一把锁喉刃,无论故障多么隐秘或问题多么棘手,你都能直击要害。 通过本文,你已经更加了解了GDB的高级调试技巧,它们将作为你解决复杂问题的利器。不要害怕深入代码的内部世界,使用这些高阶调试技巧,相信你很快就可以从调试新手成为真正的调试专家。掌控程序的命运,让那些潜伏的bug无处隐藏! **更多高级功能待您实践**
admin
2024年7月16日 11:02
转发文档
收藏文档
上一篇
下一篇
手机扫码
复制链接
手机扫一扫转发分享
复制链接
Markdown文件
分享
链接
类型
密码
更新密码